

Legal checklist before buying property in India in 2026 — title verification, RERA compliance, Bhu-Aadhaar/ULPIN, encumbrance checks, OC, and registration. Step-by-Step Legal Checklist Before Buying Property in India Before buying any property in India, verify these in order: (1) Title Deed and 30-year chain of ownership, (2) Bhu-Aadhaar (ULPIN) on the Bhu-Naksha portal, (3) Encumbrance Certificate for the last 15–30 years, (4) RERA registration for new/under-construction projects, (5) Land use and NA conversion status, (6) Building Plan Approval and sanctioned layout, (7) Occupancy Certificate (for ready-to-move), (8) No-Dues and NOC certificates, (9) Stamp duty and Sale Deed verification, and (10) Biometric Aadhaar registration. Skipping or rushing any of these steps can result in ownership disputes, loan rejection, or complete financial loss. This article is a companion to our Complete Guide to Calculating Property Investment ROI. Understanding legal risk is as important as understanding financial return — a legally defective property can wipe out every rupee of ROI no matter how well the numbers looked on paper. Why Legal Due Diligence Is Non-Negotiable in 2026 Buying property is often the single largest financial decision a person makes. And yet, many buyers spend more time comparing kitchen tiles than verifying the title. The stakes are asymmetric: the cost of a legal consultant is typically less than 0.1% of the property value, but the cost of a legal mistake can be 100% of your investment. The good news is that 2026 has materially reduced the scope for certain kinds of fraud. The Indian government has aggressively pushed for digitization to eliminate “Benami” transactions and identity theft. The Unique Land Parcel Identification Number (ULPIN), now commonly known as Bhu-Aadhaar, is the most significant update — every plot of land now has a unique digital ID based on GPS coordinates. Despite this progress, the burden of “Caveat Emptor” (Buyer Beware) still rests squarely on the buyer’s shoulders. Here is the complete checklist, organized chronologically in the order you should execute it. Phase 1: Before Paying Any Token Amount These checks must happen before you sign anything or transfer any money — even a “booking advance.” Step 1: Verify the Title Deed and Chain of Ownership The Title Deed is the foundational document of any property transaction. It is the primary document that proves ownership and must be registered at the Sub-Registrar’s office. While the current Sale Deed tells you who owns the property today, the Mother Deed tells you who owned it previously. Always insist on a 30-year flow of title — tracing the unbroken chain of ownership to confirm there are no gaps, disputes, or irregular transfers buried in the history. Red flags to watch for: If the seller only has a General Power of Attorney (GPA) or an Agreement to Sell without a registered Sale Deed, the title is incomplete and potentially illegal. Buying property solely through a General Power of Attorney — without a registered Sale Deed — is not a legal transfer of title, as affirmed by the Supreme Court of India. Any seller unwilling to produce originals (not photocopies) of the title documents. Step 2: Verify the Bhu-Aadhaar (ULPIN) The 14-digit Unique Land Parcel Identification Number is the “Aadhaar for Land” — it provides the precise GPS coordinates and ownership details of every surveyed plot. Always match the ULPIN on the document against the digital map on the official state Bhu-Naksha portal. Never buy a plot without completing this step. If the boundaries shown on the digital map do not match the physical boundaries or the Sale Deed, do not proceed with the transaction. Step 3: Check the Encumbrance Certificate (EC) The Encumbrance Certificate is issued by the Sub-Registrar’s office and records every registered transaction on the property — mortgages, liens, legal charges, and prior sales. Always verify the EC for at least 15 years, and ideally 30. A clean EC confirms the property has no outstanding loans, legal charges, or ownership claims attached to it. Where to verify: The EC can be obtained from the Sub-Registrar’s office or through state land records portals, many of which are now digitized. Step 4: Verify Land Use and NA Conversion Status In India, land is by default classified as “Agricultural.” If you are buying a property on land that has not been legally converted to “Residential Use” (NA Conversion), the construction is deemed unauthorized. Verify the DC Conversion papers carefully — this is a critical check for properties in peripheral or emerging corridors where residential projects are sometimes launched on land still awaiting conversion. Step 5: Check for Pending Litigation or Court Orders Ask the seller for a written declaration that the property is free from litigation, then independently verify using the district court’s online case search portal. A property with even a pending injunction or stay order can make resale or refinancing impossible for years. Phase 2: For New or Under-Construction Property These additional checks apply specifically when buying new launches or under-construction units from a builder. Step 6: RERA Registration Verification Under the Real Estate (Regulation and Development) Act, 2016, all new residential projects exceeding 500 sq. meters or 8 units must be registered with the state RERA authority. Verify the project’s RERA registration number directly on your state’s official RERA portal — not from the builder’s brochure alone — and check the Quarterly Progress Reports (QPR) to confirm the builder is utilizing the mandated 70% escrow fund correctly. A project that cannot produce a verifiable RERA number is a firm reason to walk away. Step 7: Building Plan Approval and Sanctioned Layout Check if the actual construction on the ground matches the plan approved by local authorities. In 2026, many cities use drone-based mapping to identify unauthorized extra floors or encroached balconies. If the building deviates from the sanctioned plan, it faces a high risk of demolition orders — making the unit effectively unsellable and unfinanceable. Step 8: Verify the Builder-Buyer Agreement Ensure every promise made verbally or in a brochure — flat number, floor, carpet area, amenities,

Top 10 Sectors in Gurgaon for Long-Term in 2026
A data-backed ranking of the Top 10 Sectors in Gurgaon for long-term capital appreciation in 2026 — connectivity drivers, price trends, and which each sector suits. Top 10 Sectors in Gurgaon for Long-Term Capital Appreciation For long-term capital appreciation in 2026, the strongest Gurgaon sectors cluster around three corridors — Dwarka Expressway (Sectors 102–113), New Gurgaon (Sectors 82–93), and Golf Course Extension Road (Sectors 61–70) — with Southern Peripheral Road (SPR) and select pockets of Sohna Road close behind. There’s no single “best” sector; the right one depends on your time horizon, budget, and whether you’re optimizing for appreciation, rental income, or stability. This article builds on our Complete Guide to Calculating ROI on Gurgaon Property Investment. Read that first if you haven’t, so you can apply the ROI formulas to whichever sector you shortlist from this list. How We Ranked These Sectors Capital appreciation in Gurgaon isn’t random — it follows a fairly consistent pattern tied to three drivers: infrastructure completion (expressways, metro extensions), employment proximity (corporate hubs, business districts), and supply-demand balance (limited new launches vs. growing end-user demand). Sectors entering the “infrastructure visible but not yet fully priced in” phase have historically delivered the strongest appreciation, while fully mature corridors tend to offer stability and liquidity over explosive growth. With that framework, here are the ten sectors and corridors currently positioned for the strongest long-term capital appreciation. 1. Sector 113 — Dwarka Expressway / NH-48 Junction Sector 113 sits at the point where the Dwarka Expressway meets NH-48, one of the most strategically positioned junctions in the entire corridor. As the expressway nears full completion and commercial activity accelerates around it, this location benefits from both connectivity and proximity to established business zones. Large-format residential projects from major developers have already established a strong presence here, which typically signals sustained long-term demand. Best suited for: Investors with a 5–7-year horizon comfortable with a still-maturing corridor in exchange for higher upside. 2. Sectors 102–109 — Dwarka Expressway Core This stretch links Delhi directly to Gurugram and offers strong connectivity to IGI Airport, Dwarka, and major business centres. As the superhighway approaches full completion and commercial development accelerates in the surrounding areas, property values here are positioned for substantial appreciation. Sector 103 specifically benefits from expressway access and proximity to both Delhi and the airport, while Sector 104 is increasingly viewed as a transformation play tied directly to the connectivity upgrade. Best suited for: Investors prioritizing connectivity-driven appreciation over immediate rental yield. 3. Sectors 82–93 — New Gurgaon New Gurgaon has developed into a well-planned urban district with strong road connectivity to Manesar, Delhi, and key industrial belts. Sectors 82 and 83 in particular, offer integrated townships with schools, parks, hospitals, and daily retail built into the community — a structural advantage older, more piecemeal sectors weren’t designed with. Combined with the upper Dwarka Expressway stretch, this zone tends to show the largest gap between current pricing and future potential, since infrastructure here is still maturing and hasn’t yet been fully priced in. Best suited for: Long-term capital growth investors and families prioritizing integrated, self-contained communities. 4. Sector 65 — Golf Course Extension Road Sector 65 sits in the middle of the Golf Course Extension Road belt — Gurgaon’s steadiest premium residential address. What distinguishes this pocket isn’t just housing quality, but the density of commercial and lifestyle activity around it. Appreciation here tends to be more moderate than emerging corridors, but it comes with materially lower execution risk and strong liquidity, since this is one of the most established premium markets in the city. Best suited for: Investors who want luxury positioning with a “safer, steadier” appreciation profile rather than a high-risk, high-reward bet. 5. Sectors 61–70 — Golf Course Extension Road (Broader Belt) Beyond Sector 65 itself, the broader GCX Road belt (Sectors 61–70) has cemented its position as Gurgaon’s premier luxury corridor. This area commands some of the highest rents in the city even where price appreciation has moderated, simply because tenant demand here rarely softens. Recent data shows this corridor posting some of the strongest 5-year appreciation figures in the city, alongside its already-strong rental fundamentals. Best suited for: Investors who want both meaningful appreciation and dependable rental demand in the same package. 6. Sectors 84–85 — Southern Peripheral Road (SPR) SPR connects Golf Course Extension Road to NH-48, making it a critical link in Gurgaon’s broader infrastructure network. Several luxury residential and commercial projects are currently under development here, and prices have already shown rapid movement — in some reports, doubling within just three years. The corridor still has runway left, but entry prices have already shifted meaningfully compared to a few years ago, meaning the easiest gains may be behind early entrants, while later entrants should expect a more moderate, multi-year payoff. Best suited for: Mid-to-high-budget investors with a realistic 3–5-year horizon and patience for the corridor to mature further. 7. Sector 77 — Dwarka Expressway (Entry-Level Pocket) Within the broader Dwarka Expressway corridor, Sector 77 stands out as a comparatively affordable entry point. Prices here have already doubled following the expressway’s opening, yet entry costs remain lower than those of the more premium Golf Course Extension corridor — positioning this pocket as a strong value play for mid-budget investors who missed the earliest entry window elsewhere on the expressway. Best suited for: Mid-budget investors seeking expressway-driven appreciation without Golf Course Extension-level entry prices. 8. Sector 36A — Emerging Premium Pocket Sector 36A has emerged as a notable premium pocket, distinguished by limited competing supply in its specific product category. Limited supply in a high-demand category typically supports stronger resale value over time, since scarcity protects pricing even during broader market softening. Best suited for: Investors prioritizing a differentiated, lower-competition asset over a high-volume corridor. 9. Sector 70 — SPR / Golf Course Extension Overlap Sitting at the overlap between SPR and the Golf Course Extension corridor, Sector 70 benefits from growing residential density alongside infrastructure spillover from both established neighbors. This
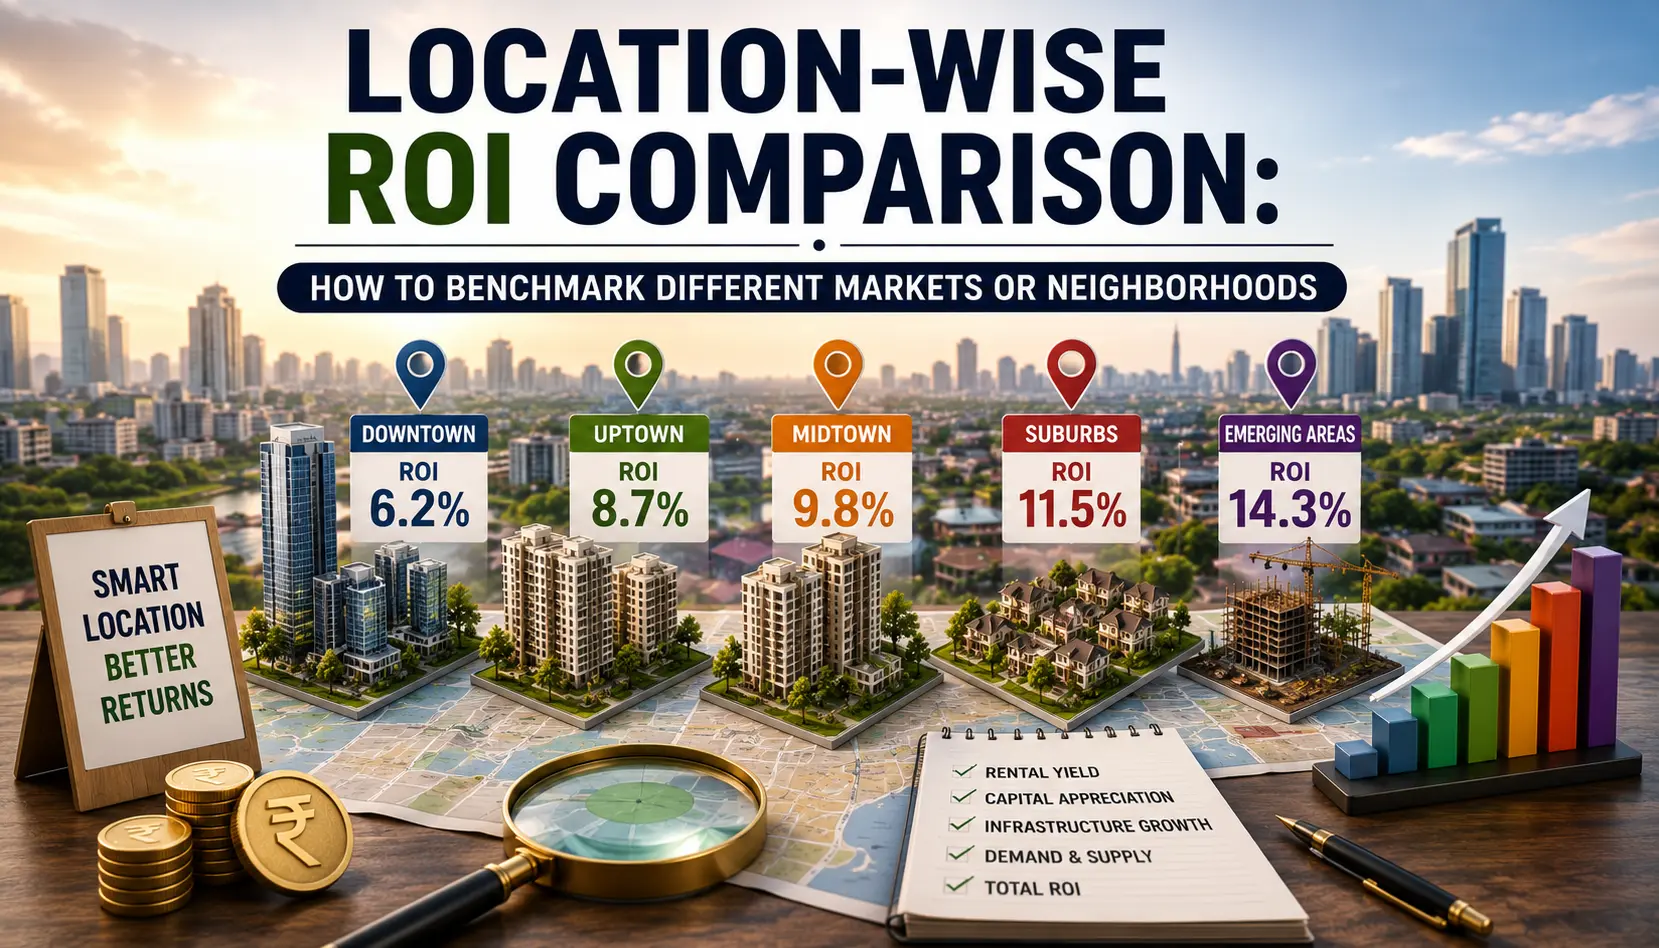
Location-wise ROI Comparison 2026
Location-wise ROI comparison across different cities, markets, or neighborhoods — what to measure, how to normalize the data, and common comparison mistakes. Location-wise ROI Comparison: How to Benchmark Different Markets or Neighborhoods Comparing property ROI across locations requires normalizing for three things most investors skip: entry price per unit area, total cost of ownership (not just headline price), and the holding period over which appreciation and yield are measured. Done correctly, a location comparison should produce a single, comparable Total ROI figure per market — not a side-by-side of unrelated metrics like “this one has better yield” vs. “that one has better appreciation.” This article is a companion to our Complete Guide to Calculating Property Investment ROI and builds on the framework from Hidden Costs That Kill Your Property ROI. Read both first if you haven’t — this piece assumes you understand Total Cost of Ownership and the core ROI formula. Why Most Location Comparisons Are Done Wrong The most common mistake in comparing two markets or neighborhoods is comparing the wrong things side by side: one location’s rental yield against another’s appreciation rate, or one’s price per square foot against another’s absolute price. None of these comparisons are apples-to-apples, and all of them lead to confident but incorrect conclusions. A proper location comparison needs a consistent framework applied identically across every market you’re evaluating. Otherwise, you’re not comparing locations — you’re comparing whichever statistic happened to look best for each one. The Four Metrics That Actually Matter 1. Entry Price (Normalized per Unit Area) Never compare absolute prices across locations — always normalize to price per square foot/meter, since unit sizes vary widely between markets. Normalized Entry Price = Total Purchase Price ÷ Built-up Area A larger unit in one market and a smaller unit in another can have wildly different absolute prices while representing similar or even worse value — normalizing strips that distort. 2. Rental Yield (Net, Not Gross) Net Rental Yield (%) = [(Annual Rent − Annual Expenses) ÷ Total Cost of Ownership] × 100 Always compare net yield across locations, never gross. Gross yield ignores maintenance, taxes, and vacancy — all of which vary significantly by market and can flip a comparison entirely once included. 3. Historical Appreciation (Annualized, Same Time Window) Annualized Appreciation (%) = [(Current Value ÷ Purchase Price)^(1 ÷ Years) − 1] × 100 This is where most comparisons quietly go wrong: comparing one location’s 3-year appreciation against another’s 5-year appreciation. Always use the same time window for every location in your comparison, and annualize the result so periods of different lengths become directly comparable. 4. Total Cost of Ownership Ratio TCO Ratio = Total Cost of Ownership ÷ Base Purchase Price Transaction taxes, brokerage, and other acquisition costs vary by jurisdiction — sometimes significantly. A location with a lower headline price but a much higher TCO ratio (due to higher stamp duty or transfer taxes, for example) can end up costing more in real terms than a location with a higher headline price and lower transaction costs. Building a Location Comparison Table Once you have these four metrics for each location, combine them into a single Total ROI figure using the same formula across every row: Total ROI (%) = [(Net Annual Rental Income + Annualized Appreciation Value) ÷ Total Cost of Ownership] × 100 Example comparison framework: Location Normalized Entry Price Net Rental Yield Annualized Appreciation TCO Ratio Total ROI Market A High Low High Moderate Moderate-High Market B Moderate Moderate Moderate Low Moderate Market C Low High Low High Moderate Notice that in this illustrative table, no single location wins on every metric — and that’s normal. The point of the table isn’t to find a location that dominates on everything; it’s to make the trade-offs explicit so you can choose based on what you’re actually optimizing for (see our companion piece on rental yield vs. capital appreciation for that decision framework). Common Mistakes When Comparing Locations 1. Comparing Different Time Windows Comparing a market’s 3-year appreciation to another’s 5-year appreciation without annualizing both will make the longer window look misleadingly stronger simply because it has more time to compound. 2. Ignoring Transaction Cost Differences Two markets can have identical headline prices and identical rental yields, yet deliver very different real ROI purely because one has a substantially higher transaction tax or fee structure. Always run the TCO ratio before declaring a winner. 3. Using City-Wide Averages Instead of Hyperlocal Data A city’s average appreciation figure can mask enormous variation between neighborhoods or corridors within that same city. Whenever possible, benchmark at the neighborhood or micro-market level, not the city level — city-wide averages are useful for context, not for individual investment decisions. 4. Anchoring to Hype Rather Than Infrastructure Fundamentals Locations frequently see short-term price spikes driven by speculative buying or marketing momentum rather than underlying demand drivers (transit access, employment hubs, planned infrastructure). When comparing locations, weigh recent price moves against tangible, confirmed infrastructure or economic catalysts — not just recent headlines. 5. Forgetting Liquidity Differences A location can show strong theoretical ROI on paper while being genuinely difficult to exit — fewer buyers, longer time-on-market, wider bid-ask spreads. Liquidity isn’t captured in the ROI formula directly, but it materially affects your realized return and should be a qualitative factor in any comparison. A Practical Benchmarking Checklist Before concluding that one location beats another, confirm you’ve done the following for every location in your comparison: Normalized entry price per unit area, not absolute price Used net rental yield, not gross Used the same time window for appreciation, annualized Calculated each location’s specific TCO ratio (transaction taxes vary) Sourced data at the neighborhood/micro-market level where possible, not city-wide averages Checked whether recent appreciation is backed by confirmed infrastructure/demand drivers, or driven by short-term momentum Factored in liquidity as a qualitative risk factor, separate from the ROI number FAQs Is it fair to compare an established market against an emerging one? Yes, but only if you’re explicit about

Hidden Costs That Kill Your Property ROI 2026
Stamp duty, taxes, maintenance, vacancy, and more — Hidden Costs That Kill Your Property ROI, with formulas and worked examples for any property market. The biggest hidden costs eroding property ROI are transaction taxes (stamp duty/registration, typically 5–8% of purchase price), GST or VAT on new/under-construction units where applicable, brokerage (1–2%), legal and documentation fees, maintenance and society charges, vacancy periods, and exit costs at resale (capital gains tax, brokerage again). Together, these can reduce your real ROI by 10–20% compared to the number most buyers calculate using just the purchase price and rent. If you haven’t already, read our Complete Guide to Calculating Property Investment ROI first — this article assumes you understand the core ROI formula and builds on it. Why “Hidden” Costs Aren’t Actually Hidden — They’re Just Ignored None of the costs in this article are secret. Tax rates are published. Maintenance charges are usually disclosed before you buy. The problem isn’t visibility — it’s that most ROI calculations simply leave them out, because they’re inconvenient to include. The result: an investor calculates ROI using only the purchase price and rental income, gets a number that looks attractive, and is genuinely surprised a few years later when actual returns fall short. The gap isn’t bad luck. It’s an incomplete formula. Cost #1: Transaction Taxes (Stamp Duty / Registration / Transfer Tax) This is the largest hidden cost most buyers underestimate, and it hits you on day one — before you’ve earned a single unit of return. Depending on your jurisdiction, property transfer taxes (stamp duty, registration charges, or transfer duty) typically add 5–8% of the purchase price, though exact rates vary significantly by location, property type, and buyer category. On a property worth 100 units of currency: Transaction tax (assume 6%) = 6 units If your ROI calculation uses the base purchase price as the denominator instead of price + transaction tax, you’re overstating your return right from the start — before the property has done anything for you. Always check your local stamp duty/registration schedule before modeling ROI; rates differ widely by city, state, and country. Cost #2: GST / VAT on New or Under-Construction Property If you’re buying new-build or under-construction property (as opposed to resale/ready-to-move), consumption taxes like GST or VAT often apply — and ready-to-move buyers typically don’t face this cost at all. Where applicable, this tax is commonly in the 5–12% range on the base price, frequently with no input tax credit available to the individual buyer, meaning it can’t be offset elsewhere. This is one of the clearest reasons mixing up new-build and resale cost structures in your ROI math leads to wrong conclusions — they are not the same financial product, even within the same building. Cost #3: Brokerage / Agent Commission Brokerage in most property markets typically runs 1–3% of transaction value, paid by the buyer, the seller, or split between both, depending on local convention and the specific deal. This is easy to forget because it’s often negotiated outside the main transaction paperwork — which is exactly why it doesn’t make it into most buyers’ ROI spreadsheets. Cost #4: Legal and Documentation Fees Title verification, sale deed drafting, and conveyancing typically cost a few hundred to a few thousand units of currency, depending on the complexity of the transaction and local legal requirements. Skipping proper legal due diligence to save this cost is one of the most common false economies in real estate — title disputes and unclear records are a real risk in many markets, particularly for newer developments or peripheral areas. Cost #5: Interiors, Furnishing, and Move-In Costs Even a property marketed as “move-in ready” usually isn’t fully ready. Fittings, basic furnishing, painting, and minor repairs routinely add a meaningful lump sum to your real cost of ownership. This is a genuine cost of ownership, not optional — yet it’s rarely included when buyers calculate ROI off the base purchase price alone. Cost #6: Maintenance and Recurring Charges Ongoing, and easy to understand because it’s a small monthly number that compounds over the years. Most managed residential properties (apartments, gated communities, condos) carry monthly maintenance, society, or HOA-style charges. Even a modest monthly fee adds up to a substantial sum over a 5–10-year hold — often exceeding the combined one-time brokerage and legal costs, spread invisibly across years. Cost #7: Vacancy Periods If you’re renting the property out, vacancy is the cost everyone forgets until it happens to them. A property vacant for just 2 months a year overstates your assumed rental yield by roughly 15%, because most buyers calculate yield assuming 12 months of occupied rent. Formula: Yield Overstatement (%) ≈ (Vacant Months ÷ 12) × 100 Build a realistic vacancy buffer (1–2 months/year) into every yield calculation, not just the optimistic 12-month figure — especially in markets with seasonal demand or longer tenant turnover cycles. Cost #8: Property Tax / Council Tax Often small individually, but recurring and easy to forget in year-one excitement. Annual property tax varies by location, property value, and local government rates, and while usually modest, it still belongs in your net rental income calculation — not as an afterthought. Cost #9: Financing Costs (If Leveraged) If you’re using a mortgage or loan to fund the purchase, loan processing fees, prepayment penalties, and the interest cost itself materially affect real ROI — particularly in higher interest rate environments. A leveraged ROI calculation is fundamentally different from a cash-purchase ROI calculation, and conflating the two is a common modeling error. Cost #10: Exit Costs at Resale The cost that hits hardest because it arrives at the very end, when investors have stopped paying attention to expenses and are only thinking about the appreciation gain. Capital gains tax — applicable on the profit from sale, with rates and any indexation or exemption benefits depending on your holding period and local tax rules at the time of sale. Brokerage on the sale side — typically another 1–3%. Pending dues clearance —
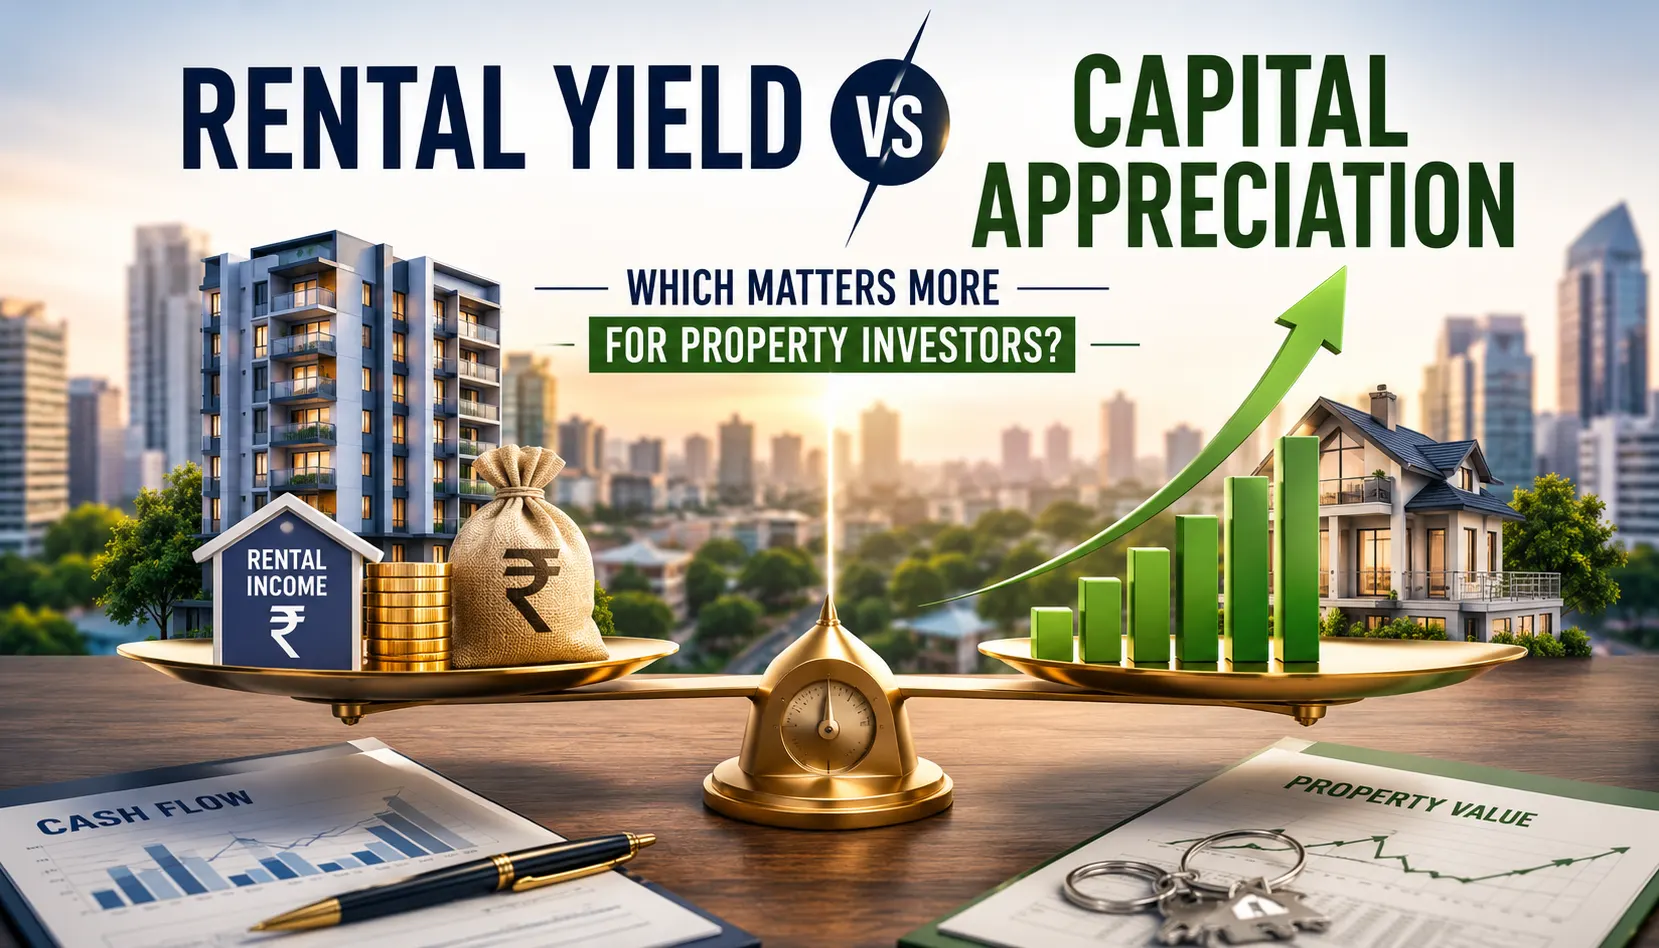
Rental Yield vs Capital Appreciation for Property Investors?
Rental yield vs capital appreciation — which actually drives returns for Gurgaon property investors in 2026? A data-backed comparison with formulas and worked examples. Rental Yield vs Capital Appreciation: Which Matters More for Property Investors? For most Gurgaon investors, capital appreciation does the heavy lifting on total returns, while rental yield provides cash flow stability. Gurgaon rental yields currently average just 2–4%, but appreciation in active sectors has run 8–30% depending on location and timeframe. The right balance depends on whether you need a monthly income now or are optimizing for long-term wealth creation. Most serious investors track both — but weight their decisions differently depending on their goals. If you haven’t already, read our Complete Guide to Calculating ROI on Property Investment first — this article assumes you understand the basic ROI formula and builds on it. Two Very Different Return Streams Every property investment generates returns through exactly two channels: Rental yield — the income the property produces while you hold it. Capital appreciation — the increase in the property’s resale value over time. They behave completely differently, are taxed differently, and reward different kinds of investors. Treating them as interchangeable is one of the most common reasons people misjudge a Gurgaon investment. Rental Yield: The Cash Flow Engine Formula: Gross Rental Yield (%) = (Annual Rent ÷ Property Price) × 100 Net Rental Yield (%) = [(Annual Rent − Annual Expenses) ÷ Total Cost of Ownership] × 100 What Gurgaon Yields Actually Looks Like Rental yields across Gurgaon currently average around 2–4%, with most established residential sectors clustering near 2%. Specific micro-markets confirm this pattern — New Gurgaon and Sector 65 both report average rental yields of roughly 2%, while more affordable, emerging corridors like Sohna tend to land slightly higher, in the 3–4% range, partly because purchase prices are lower relative to achievable rents. Why Yield Matters Predictable monthly cash flow — useful if you need income now (retirees, EMI offsetting). Lower volatility — rent doesn’t swing the way resale prices do. Easier to forecast — you can estimate rental yield with reasonable accuracy before buying, using comparable listings nearby. Why Yield Alone Disappoints in Gurgaon A 2–4% yield is lower than what you’d earn from a fixed deposit or debt mutual fund over many years. If you’re buying a Gurgaon property purely for rental income, you need to go in with realistic expectations — yield-only investors are usually better served by REITs or other income-focused instruments, not direct ownership of premium Gurgaon real estate. Capital Appreciation: The Wealth-Creation Engine Formula: Capital Appreciation (%) = [(Current Value − Purchase Price) ÷ Purchase Price] × 100 Annualized Appreciation (%) = [(Current Value ÷ Purchase Price)^(1/Years) − 1] × 100 What Gurgaon Appreciation Actually Looks Like This is where Gurgaon’s numbers get more interesting. New Gurgaon flat rates have appreciated 65.9% over 3 years and 133% over 5 years. Sector 65 has appreciated 33.8% over 3 years and 104.1% over 5 years. More broadly, premium and developing areas across Gurgaon have seen price growth of 15–30% in recent periods, and analysts expect continued annual appreciation of 10–20% in prime areas and up to 30% in emerging sectors going forward, driven largely by infrastructure expansion. Delhi-NCR’s broader momentum supports this: the region recorded 30% YoY sales growth in Q1 2026, with Gurugram alone contributing nearly 73% of regional launches — a strong demand signal that typically precedes sustained price growth in supply-constrained corridors. Why Appreciation Matters It’s where most of the real return lives in Gurgaon specifically — often 3-4x the contribution of rental yield. Compounds over the holding period — a 10% annual appreciation roughly doubles property value every 7 years. Tax-deferred until sale — unlike rental income, which is taxed annually, appreciation gains aren’t realized (or taxed) until you sell. Why Appreciation Alone Is Risky It’s not guaranteed — past appreciation reflects historical demand and infrastructure timing, not a forward promise. It’s illiquid — you can’t access appreciation gains without selling or refinancing. It’s concentrated risk — a property-only portfolio betting purely on appreciation lacks the diversification a balanced investor typically wants. Recent quarterly data show some premium corridors, like Golf Course Road, can also see short-term depreciation (around 8% in one recent quarter) even within a longer-term uptrend — appreciation is not a straight line. Side-by-Side: Gurgaon Micro-Markets Micro-market Rental Yield 3-Yr Appreciation Best Suited For Golf Course Road 2–3% Premium, slower % growth, high base Long-term wealth preservation Sector 65 ~2% 33.8% Balanced growth investors New Gurgaon ~2% 65.9% Appreciation-focused, longer horizon Dwarka Expressway 2–3% Mixed, some recent appreciation Infrastructure-driven bets Sohna 3–4% High-growth, emerging Yield + early-stage appreciation So Which One Should You Prioritize? It depends on what problem you’re actually solving. Choose to weight rental yield more if: You need the property to partially or fully cover its own EMI. You’re investing for passive income in retirement. You have a shorter time horizon (3–5 years) and can’t rely on appreciation playing out. You value liquidity and predictability over upside. Choose to weight capital appreciation more if: You have a 7–10-year (or longer) holding horizon. You’re investing in an emerging corridor with confirmed infrastructure pipelines (metro extensions, expressways). You don’t need the rental income to service the investment. You’re comfortable with the illiquidity and lack of a guaranteed outcome. The realistic answer for most investors Most successful Gurgaon investors don’t choose one — they sequence them. Early in the holding period (years 1–5), a modest rental yield offsets carrying costs. Later (years 5–10+), appreciation becomes the dominant return driver as the surrounding infrastructure matures and the sector re-rates. This is exactly why the Total ROI formula in our complete guide combines both — calculating either in isolation gives you an incomplete, often misleading picture of your actual return. A Quick Gut-Check Example Two investors, same ₹1 crore budget, different sectors: Investor A — Golf Course Road Lower yield (~2%), high base price Slower % appreciation, but on a larger base Total ROI: moderate,
How to calculate ROI on Property Investment 2026
Learn exactly how to calculate ROI on property investment in 2026 — rental yield, capital appreciation, total cost of ownership, formulas, and worked examples Calculate ROI on Property Investment in 2026 ROI on a Gurgaon property is calculated by adding your annual rental income (net of expenses) plus annual capital appreciation, divided by your total cost of ownership (purchase price + stamp duty + registration + brokerage + interiors), expressed as a percentage. In 2026, most Gurgaon residential properties deliver a 2–4% rental yield, with total ROI (including appreciation) typically landing between 8–14% annually in established sectors and higher in fast-growing corridors. This guide breaks down every component of that calculation, with real formulas and worked examples using current Gurgaon market data. Why ROI Calculation Matters More in Gurgaon Than in Most Cities Gurgaon isn’t a uniform market — it’s dozens of micro-markets stitched together, each with wildly different price points and growth trajectories. Golf Course Road commands an average asking price of around ₹21,350 per sq ft, while Sohna offers a far more accessible entry point near ₹9,900 per sq ft. Areas along Dwarka Expressway range from affordable pockets under ₹5,000 per sq ft to premium sectors starting around ₹6,500 per sq ft and above. That spread means two investors who each spend ₹1 crore in Gurgaon could end up in completely different ROI brackets depending on the sector, simply because rental demand, appreciation rate, and total cost of ownership vary so much from sector to sector. A proper ROI calculation — not gut feeling or a broker’s pitch — is what separates a good Gurgaon investment from a mediocre one. The Three Components of Real Estate ROI Every property ROI calculation rests on three pillars. Get any one of them wrong, and your final number is meaningless. 1. Rental Yield The annual income your property generates as a percentage of what you paid for it. 2. Capital Appreciation How much the property’s market value grows over your holding period. 3. Total Cost of Ownership (TCO) Not just the sticker price — everything you actually spent to acquire and hold the asset. Let’s calculate each one properly. 1. Calculating Rental Yield in Gurgaon Formula: Gross Rental Yield (%) = (Annual Rental Income ÷ Property Purchase Price) × 100 Net Rental Yield (more accurate): Net Rental Yield (%) = [(Annual Rent − Annual Expenses) ÷ Total Cost of Ownership] × 100 Annual expenses typically include maintenance charges, property taxes, society fees, repairs, and any vacancy periods. Worked Example Suppose you buy a 2 BHK in a New Gurgaon sector. A typical 2 BHK in Gurgaon costs around ₹85 lakh, and you rent it out for ₹22,000/month. Annual rent: ₹22,000 × 12 = ₹2,64,000 Annual expenses (maintenance, tax, ~1 month vacancy): ₹40,000 Net annual income: ₹2,64,000 − ₹40,000 = ₹2,24,000 Purchase price: ₹85,00,000 Net Rental Yield = (2,24,000 ÷ 85,00,000) × 100 = 2.6% This tracks closely with current market data — rental yields in Gurgaon currently hover around 2–4%, and specific micro-markets like New Gurgaon report average rental yields of roughly 2%. Rental yield alone, in other words, will rarely make a Gurgaon property look like a great investment. That’s where appreciation comes in. 2. Calculating Capital Appreciation Formula: Capital Appreciation (%) = [(Current Market Value − Purchase Price) ÷ Purchase Price] × 100 For annualized appreciation over a multi-year hold: Annualized Appreciation (%) = [(Current Value ÷ Purchase Price)^(1 ÷ No. of Years) − 1] × 100 Worked Example Using the Sector 65 micro-market as a reference point, flat rates there have risen 33.8% over the last 3 years and 104.1% over the last 5 years. If you bought at ₹15,000/sq ft three years ago and the sector now trades at ₹20,000/sq ft: Capital Appreciation = [(20,000 − 15,000) ÷ 15,000] × 100 = 33.3%Annualized = (20,000 ÷ 15,000)^(1/3) − 1 = 10.1% per year Appreciation is rarely linear, and it varies sharply by location. Premium and emerging Gurgaon sectors have both seen price growth of 15–30% in recent periods, while Gurgaon’s residential market is expected to see 10–20% annual appreciation in prime areas and up to 30% in emerging sectors going forward, driven by infrastructure expansion. Treat these as directional ranges, not guarantees — always check the specific sector’s 3-year and 5-year trend before assuming a number. 3. Calculating Total Cost of Ownership (TCO) This is the step most first-time investors skip — and it’s the one that quietly erodes ROI the most. Formula: TCO = Purchase Price + Stamp Duty + Registration Charges + GST (if under-construction) + Brokerage + Legal Fees + Interior/Furnishing Costs + Loan Processing Fees In Haryana, stamp duty and registration on Gurgaon property typically add 6–7% to the base price (varying by buyer category and municipal limits), GST applies only to under-construction property (currently 5% for non-affordable housing, without input tax credit), and brokerage usually runs 1–2% of transaction value. Worked Example (continuing the ₹85 lakh 2 BHK) Cost Component Amount Base purchase price ₹85,00,000 Stamp duty + registration (~7%) ₹5,95,000 Brokerage (1%) ₹85,000 Legal/documentation ₹25,000 Interiors/furnishing ₹3,00,000 Total Cost of Ownership ₹95,05,000 Notice the gap: the “price” was ₹85 lakh, but your real investment is closer to ₹95 lakh — roughly 12% higher. Every ROI formula below should use this TCO figure, not the base price, or your return will look artificially inflated. Putting It All Together: The Total ROI Formula Total ROI (%) = [(Net Annual Rental Income + Annual Capital Appreciation) ÷ Total Cost of Ownership] × 100 Full Worked Example Using our 2 BHK example over a 1-year holding snapshot: Total Cost of Ownership: ₹95,05,000 Net annual rental income: ₹2,24,000 Assumed annual appreciation (mid-range sector estimate, ~8%): ₹85,00,000 × 8% = ₹6,80,000 Combined annual return: ₹2,24,000 + ₹6,80,000 = ₹9,04,000 Total ROI = (9,04,000 ÷ 95,05,000) × 100 = 9.5% That 9.5% figure is a far more honest picture than the 2.6% rental yield alone — and it’s roughly in line with where most established Gurgaon